CASE STUDY
AI Insights
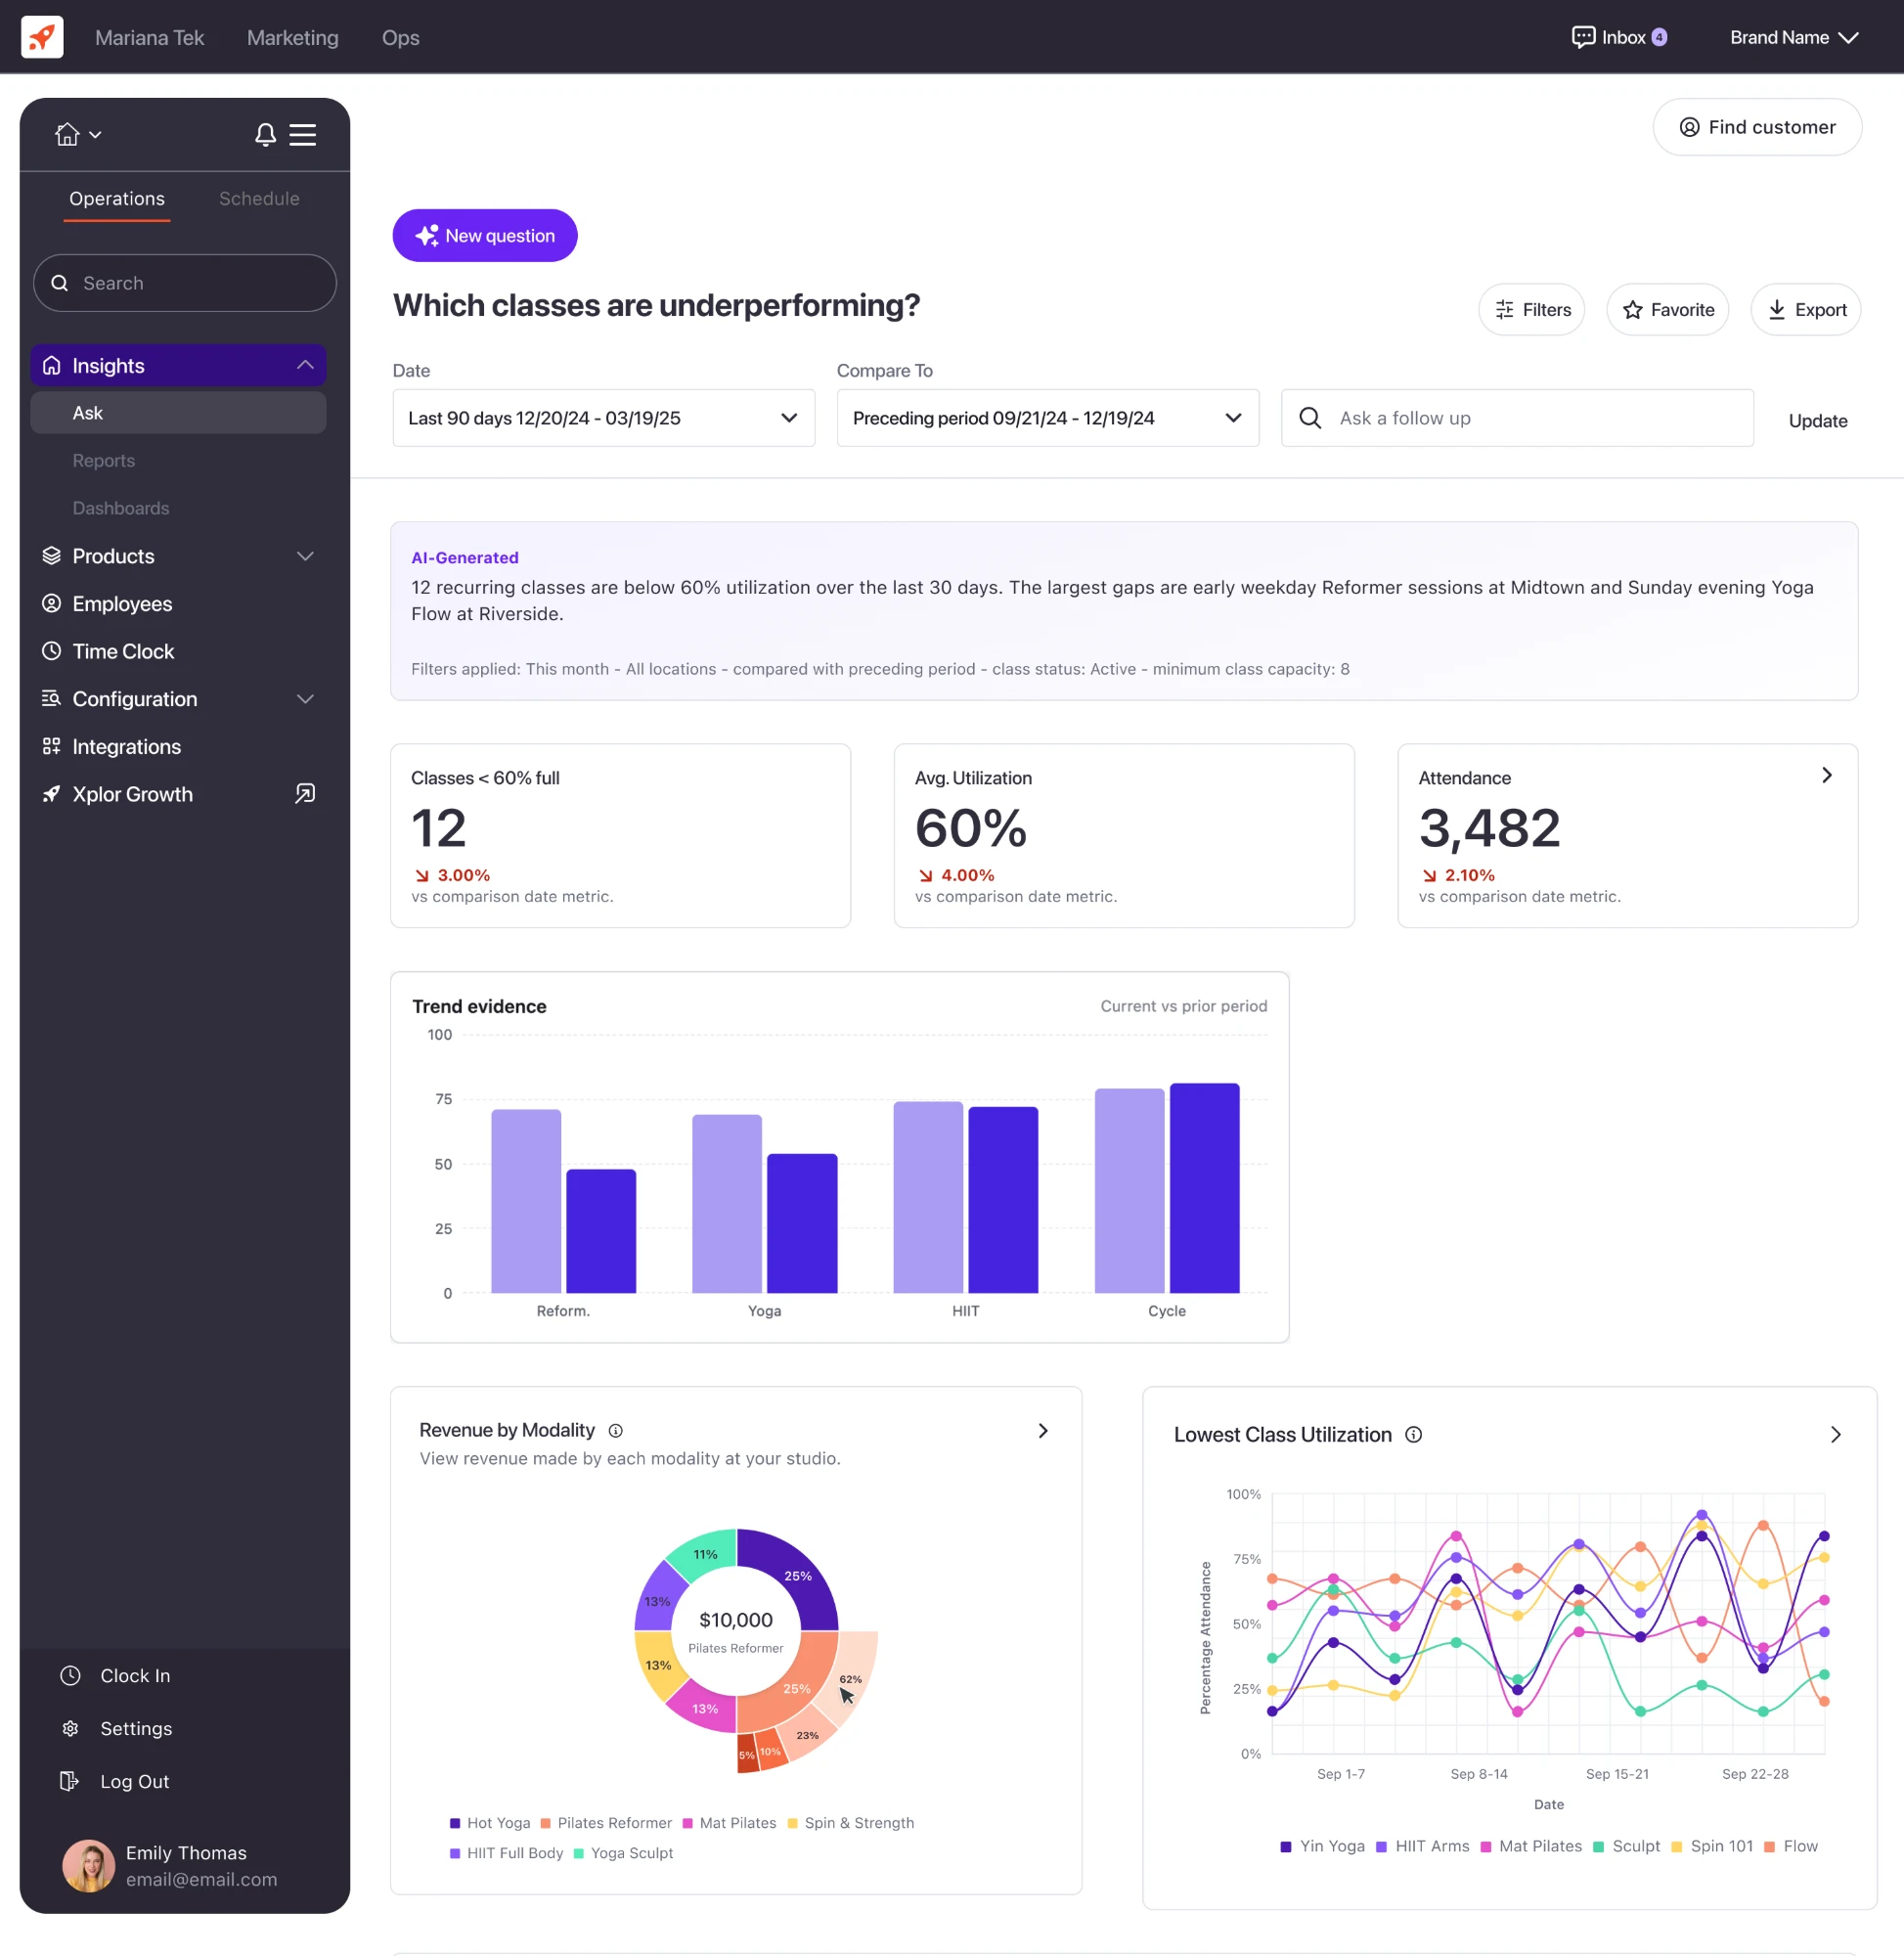
Helping our clients better understand their business through an AI-powered workspace. By asking questions, they can turn complex data into clear, interactive visualizations that drive actionable insights.
- Product
- Role
Problem Statement
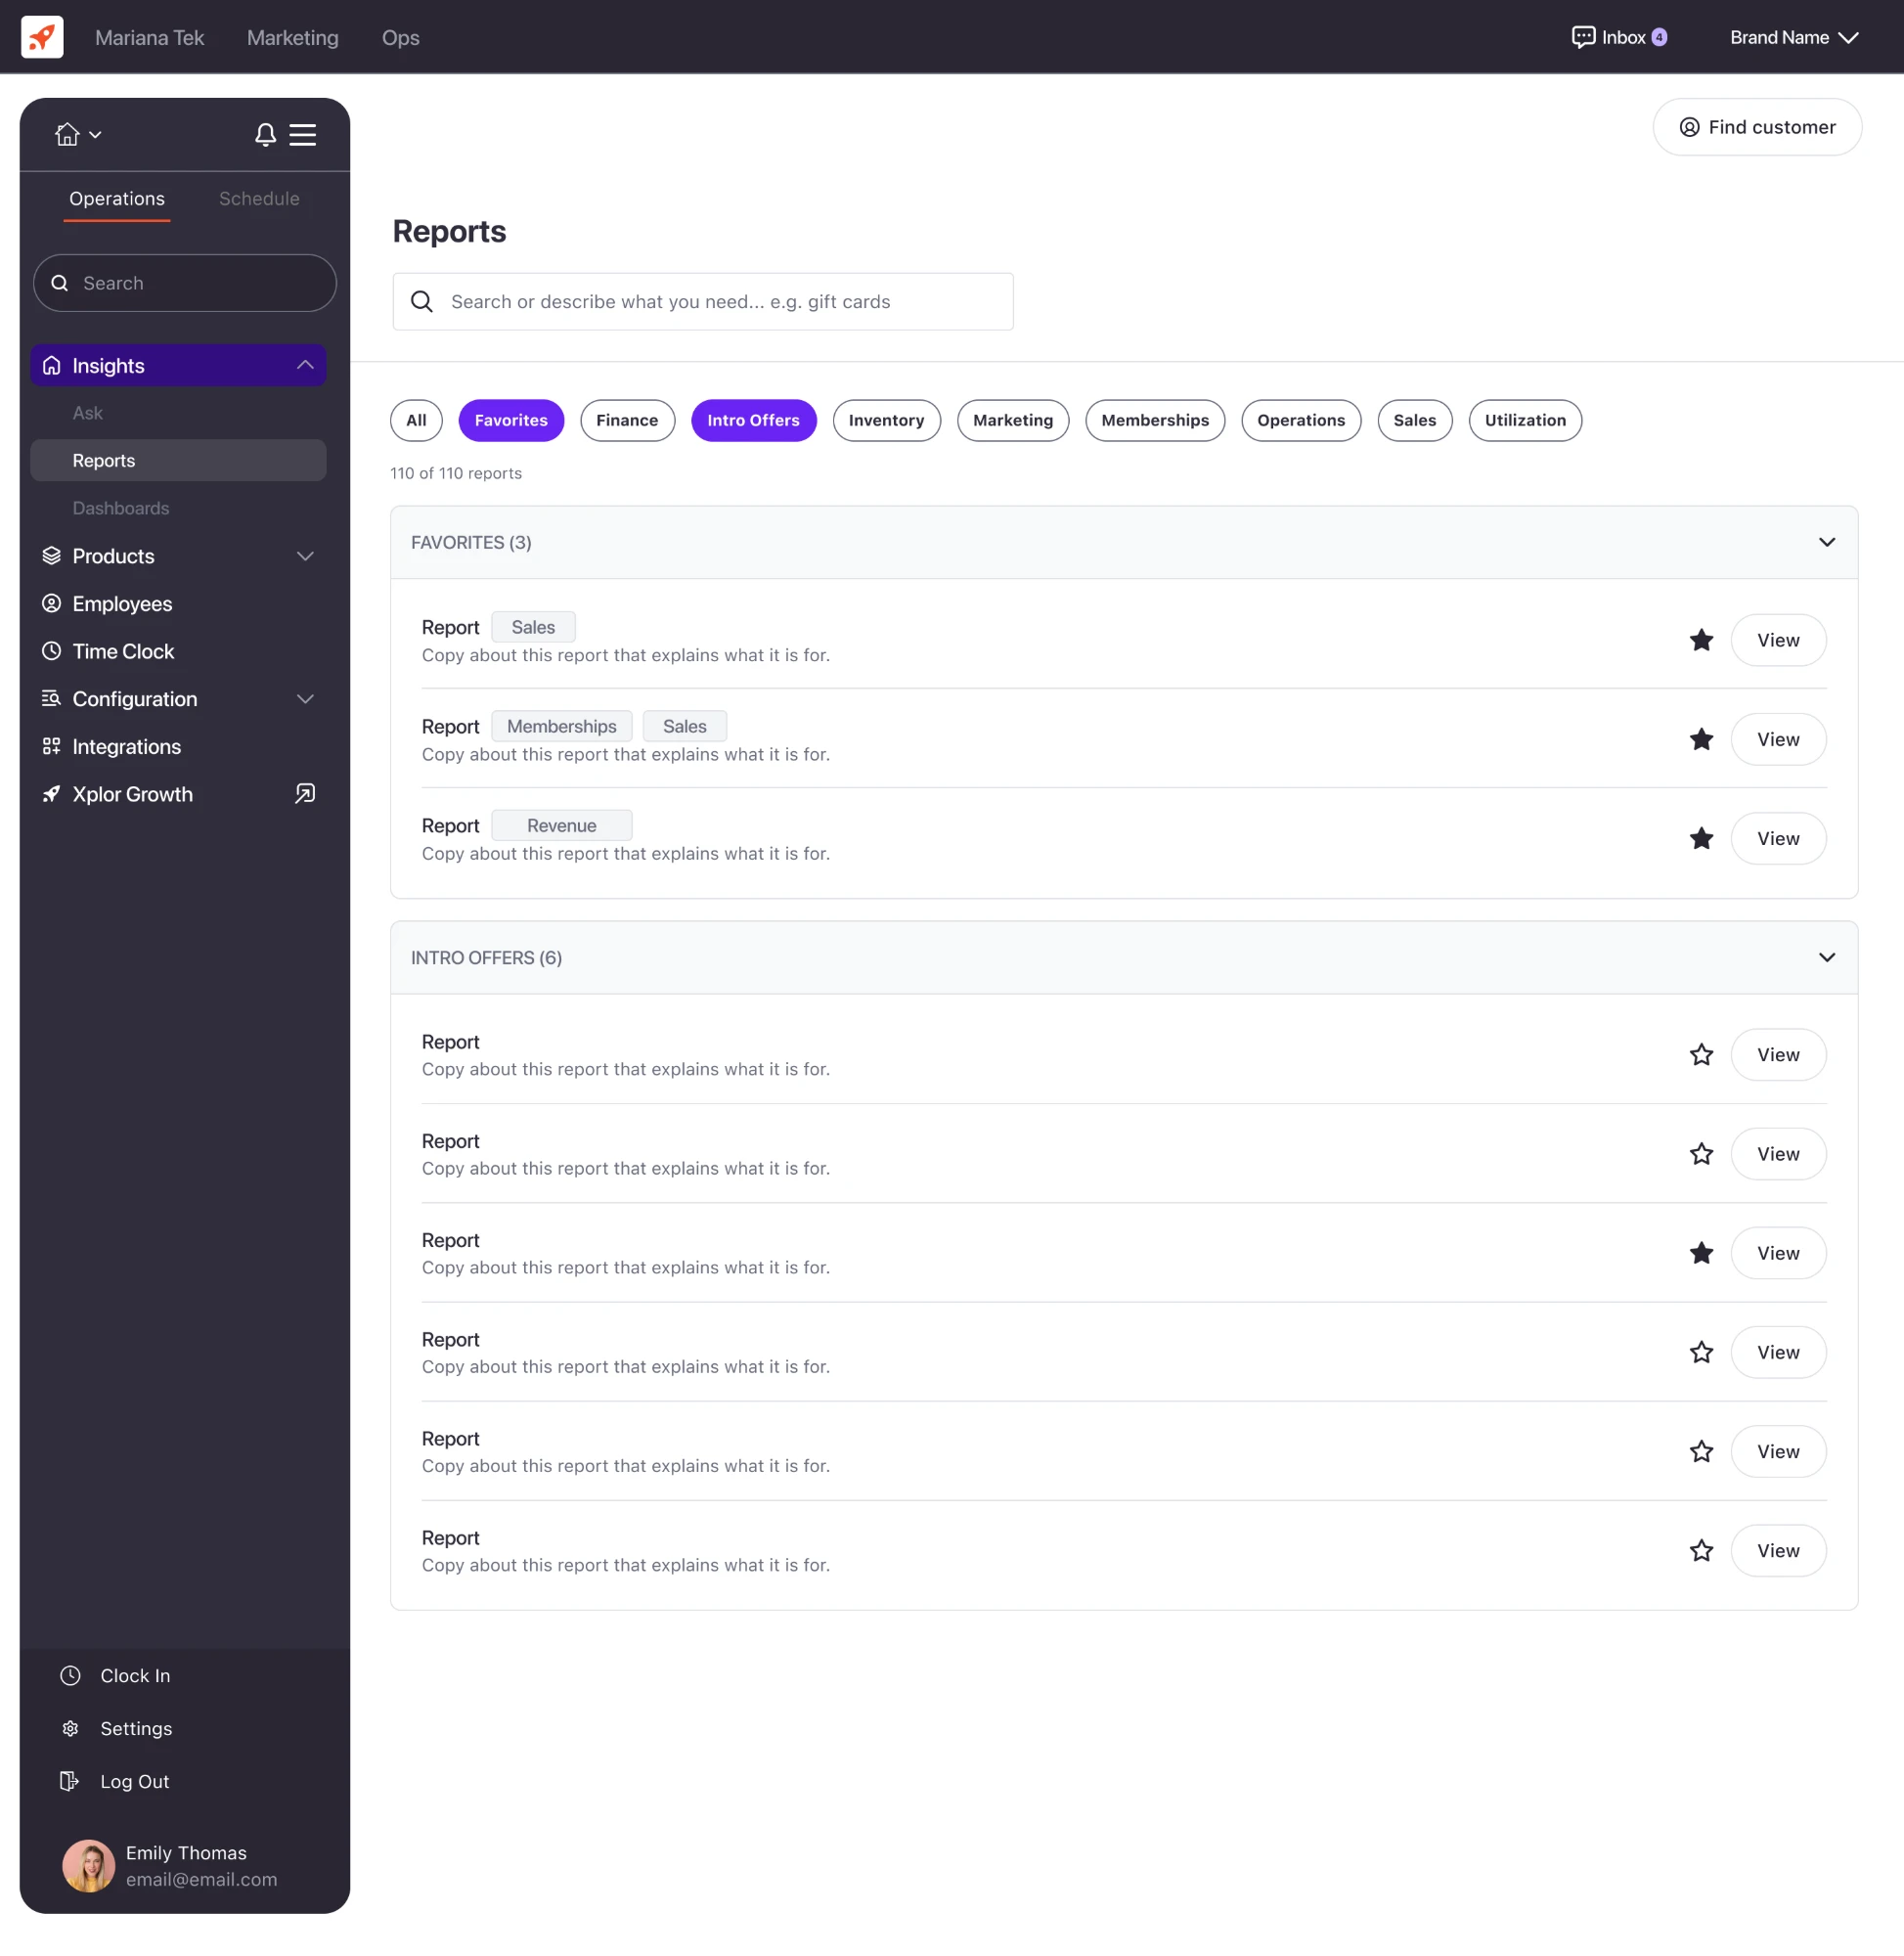
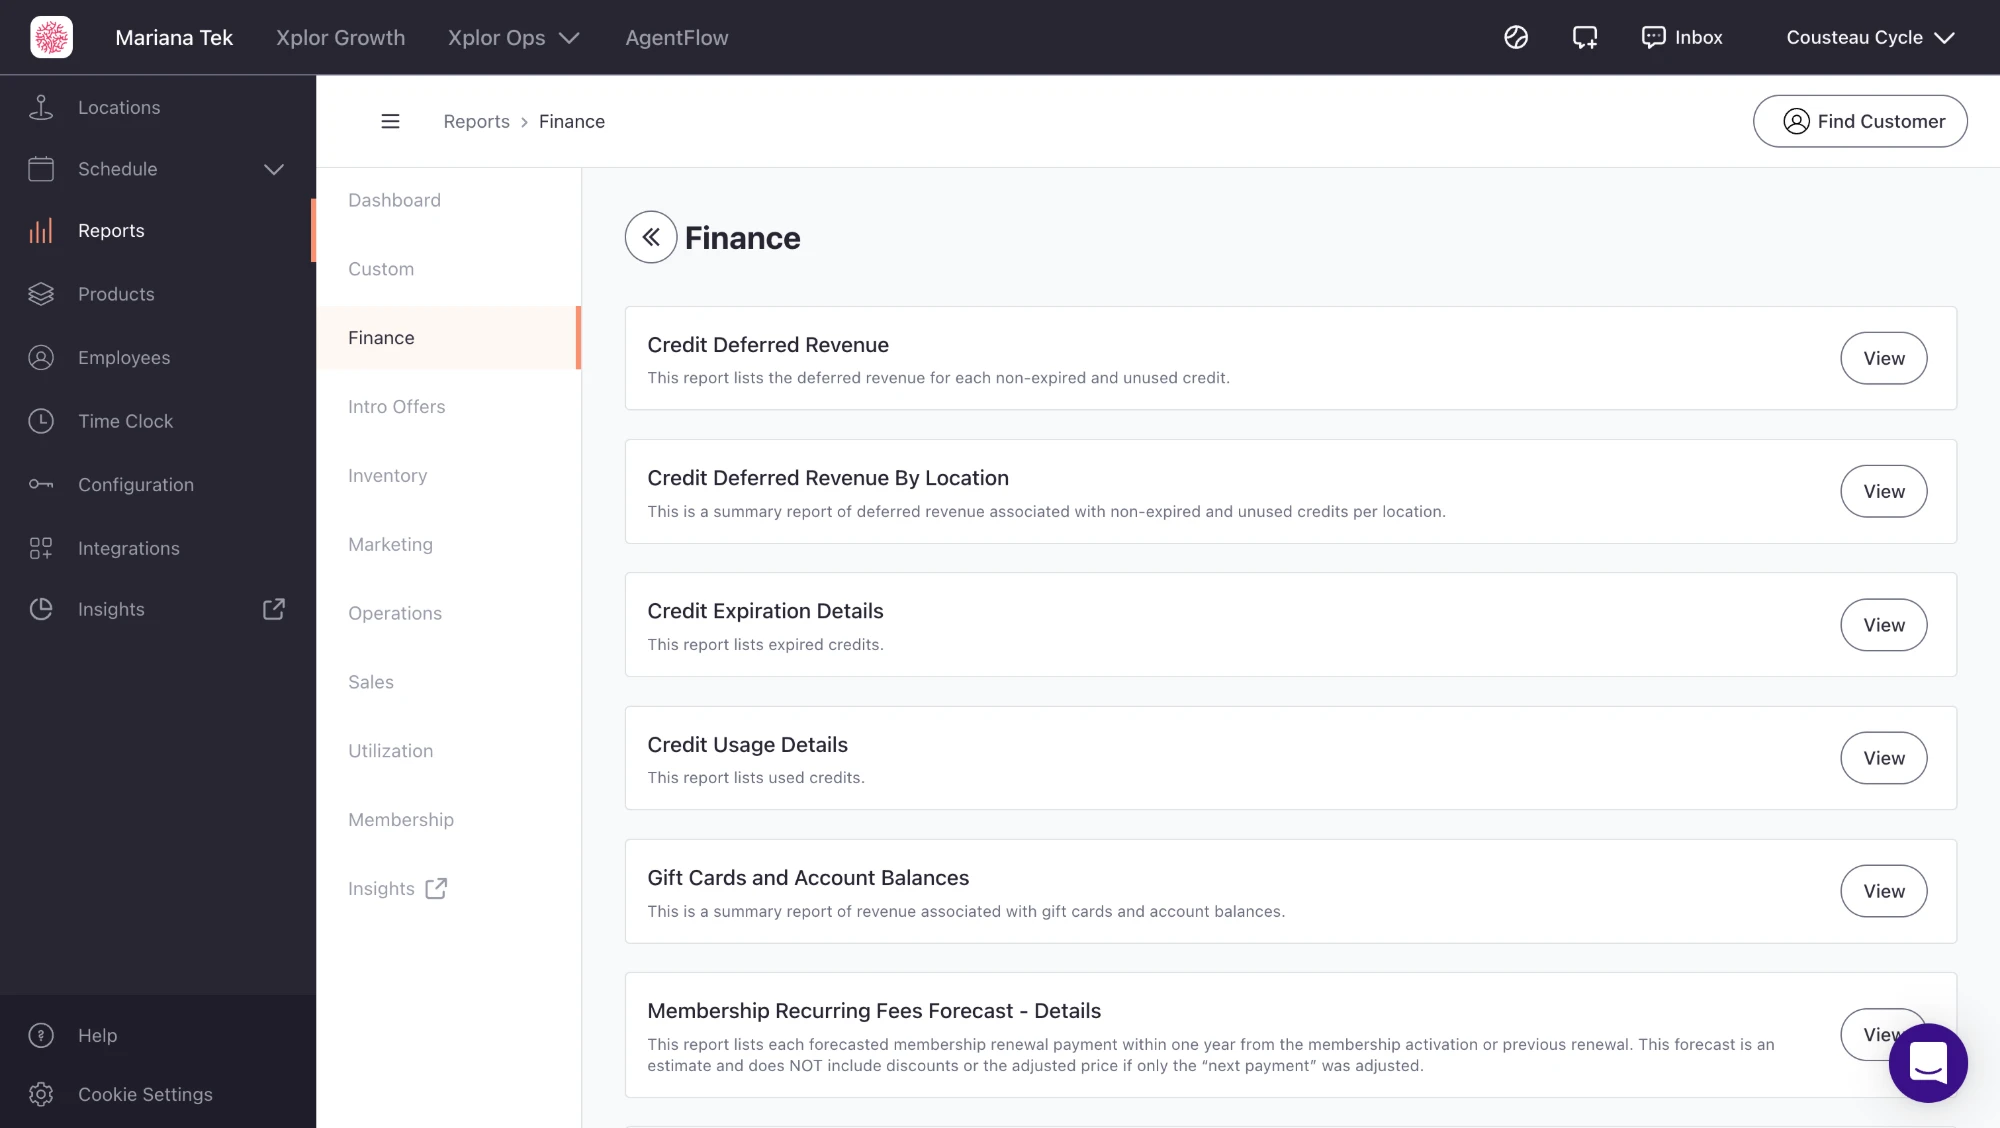
Users who do routine reporting tasks often struggle to find the information they need because of how the reports are organized, such as membership reports appearing under “Marketing.” This requires staff to search through multiple categories, increasing the time and effort needed to complete their reporting tasks.
“I can’t find the report I need, I have to hunt through categories… no search, no favorites, and the categories don’t make sense”
“If there was a search bar at the top, it would probably save me 20 minutes a day.”
“Each time I go to the reports, I have to open each category to figure out where the report I’m looking for is stored.”
“I would like to submit a favorite button on reports so I can get to them quickly.”
“[Studio name] would like to be able to ‘favorite’ reports… (MBO has this)”
Research
I sent out a research test to 64 clients to get user feedback on this feature. I summarized the results to share with my team before taking next steps.
Discovery & Feedback
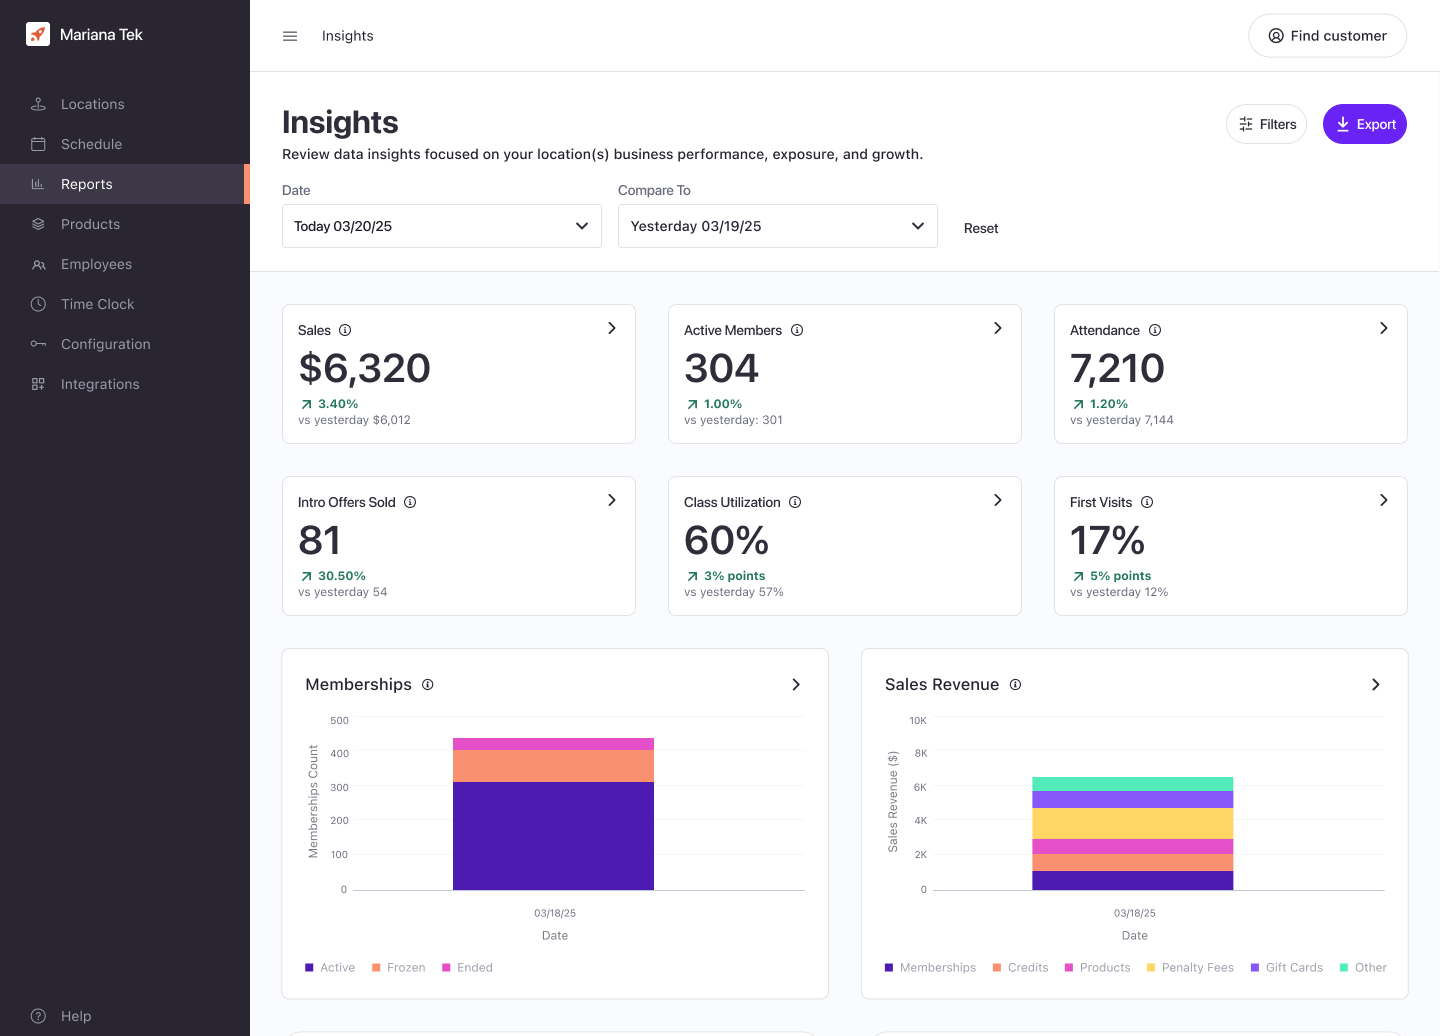
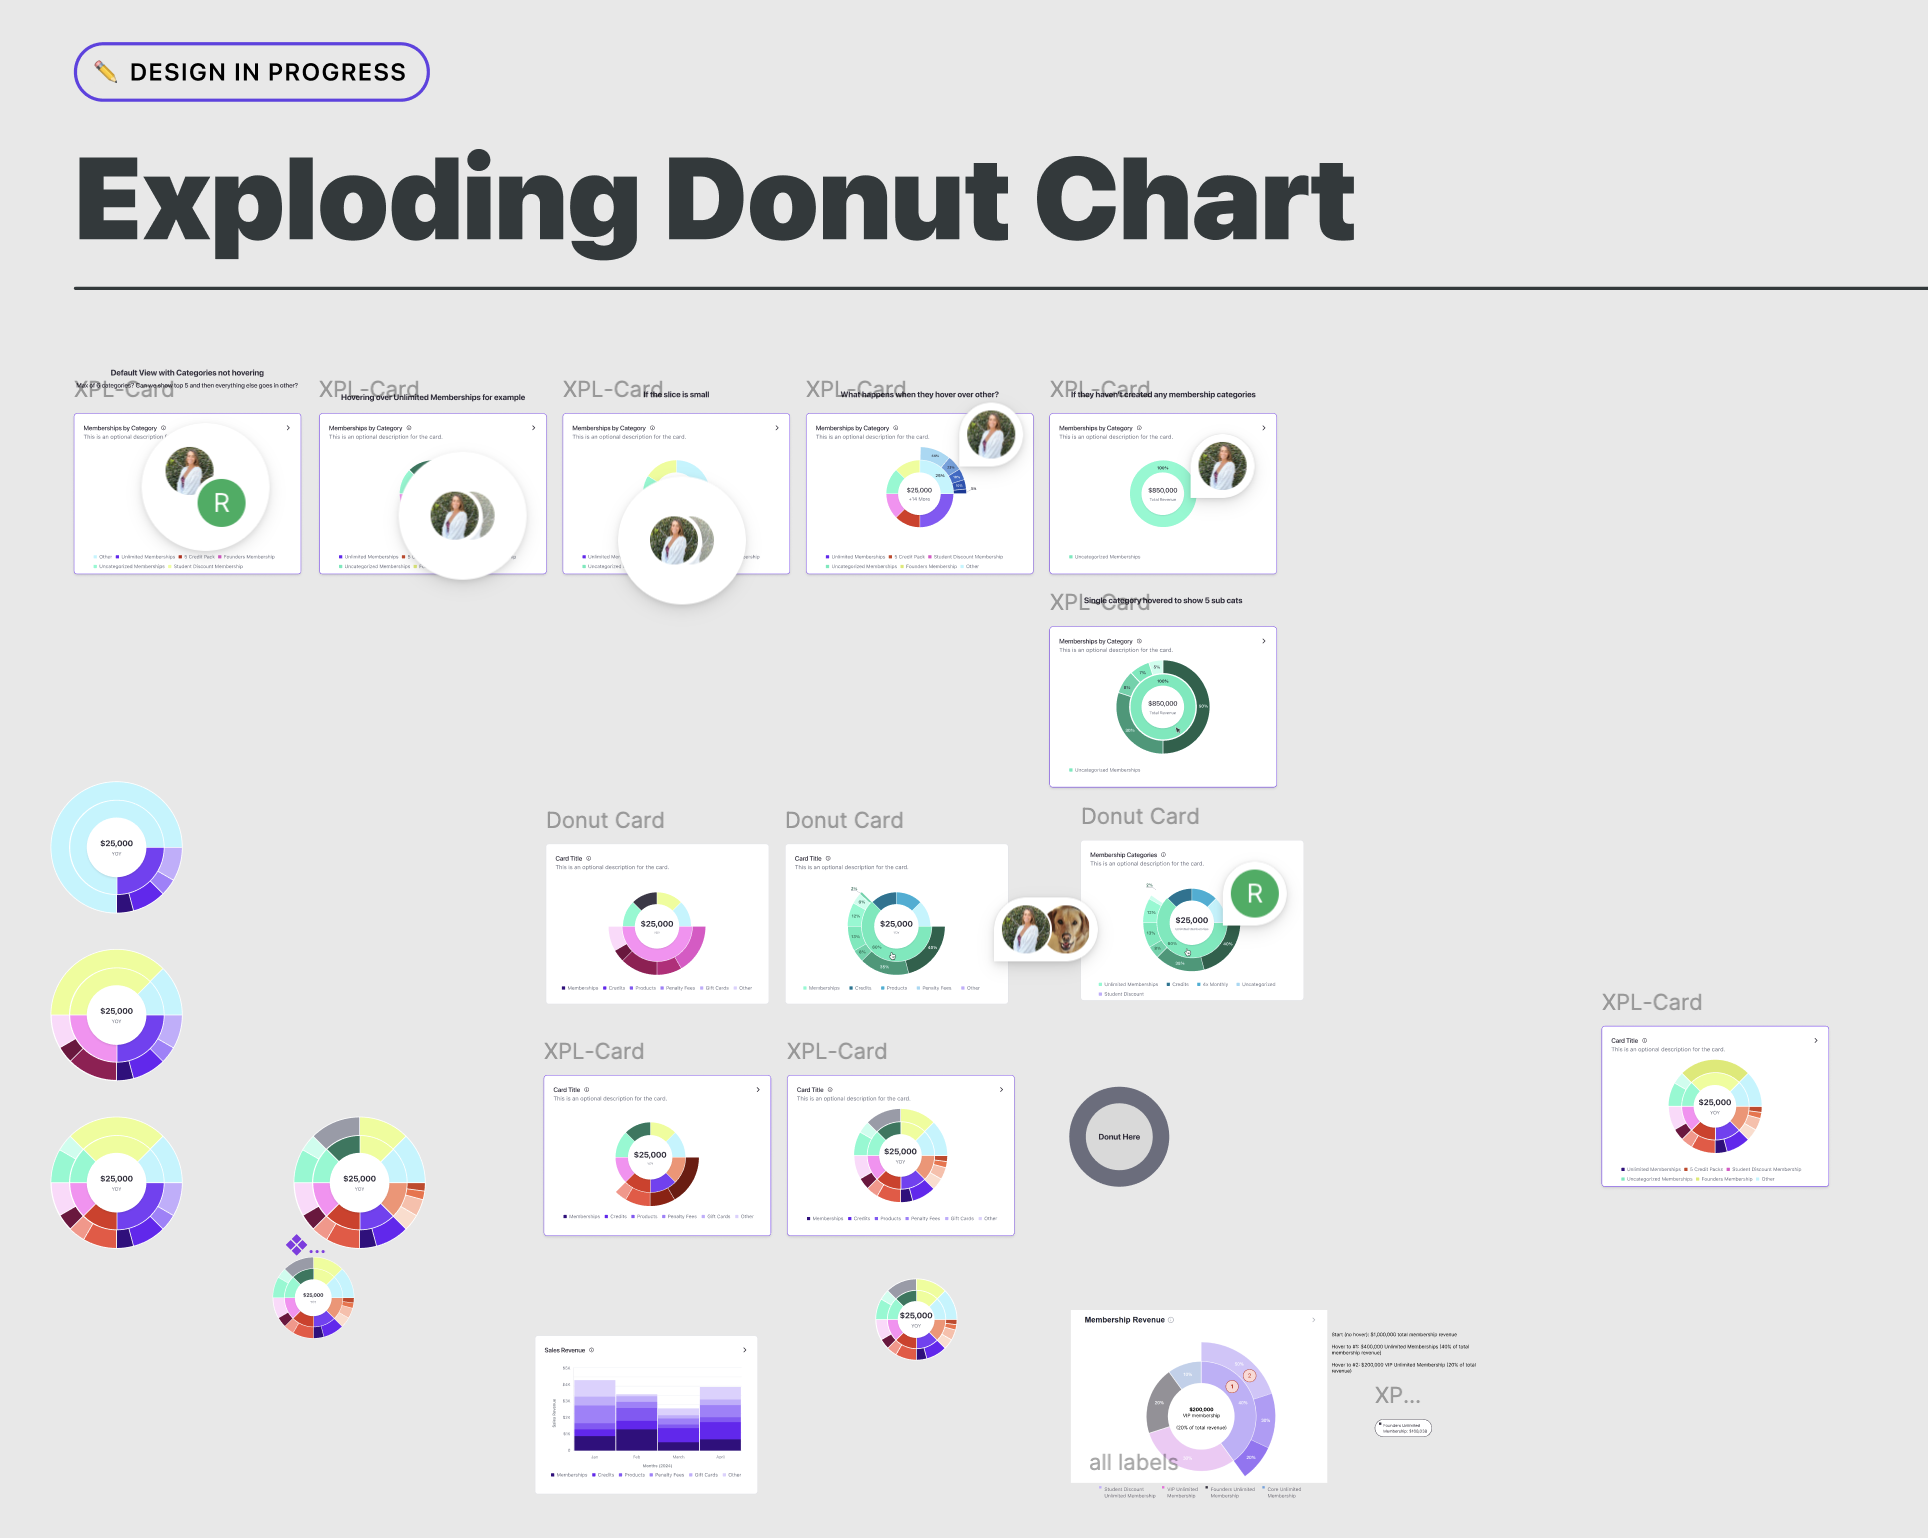
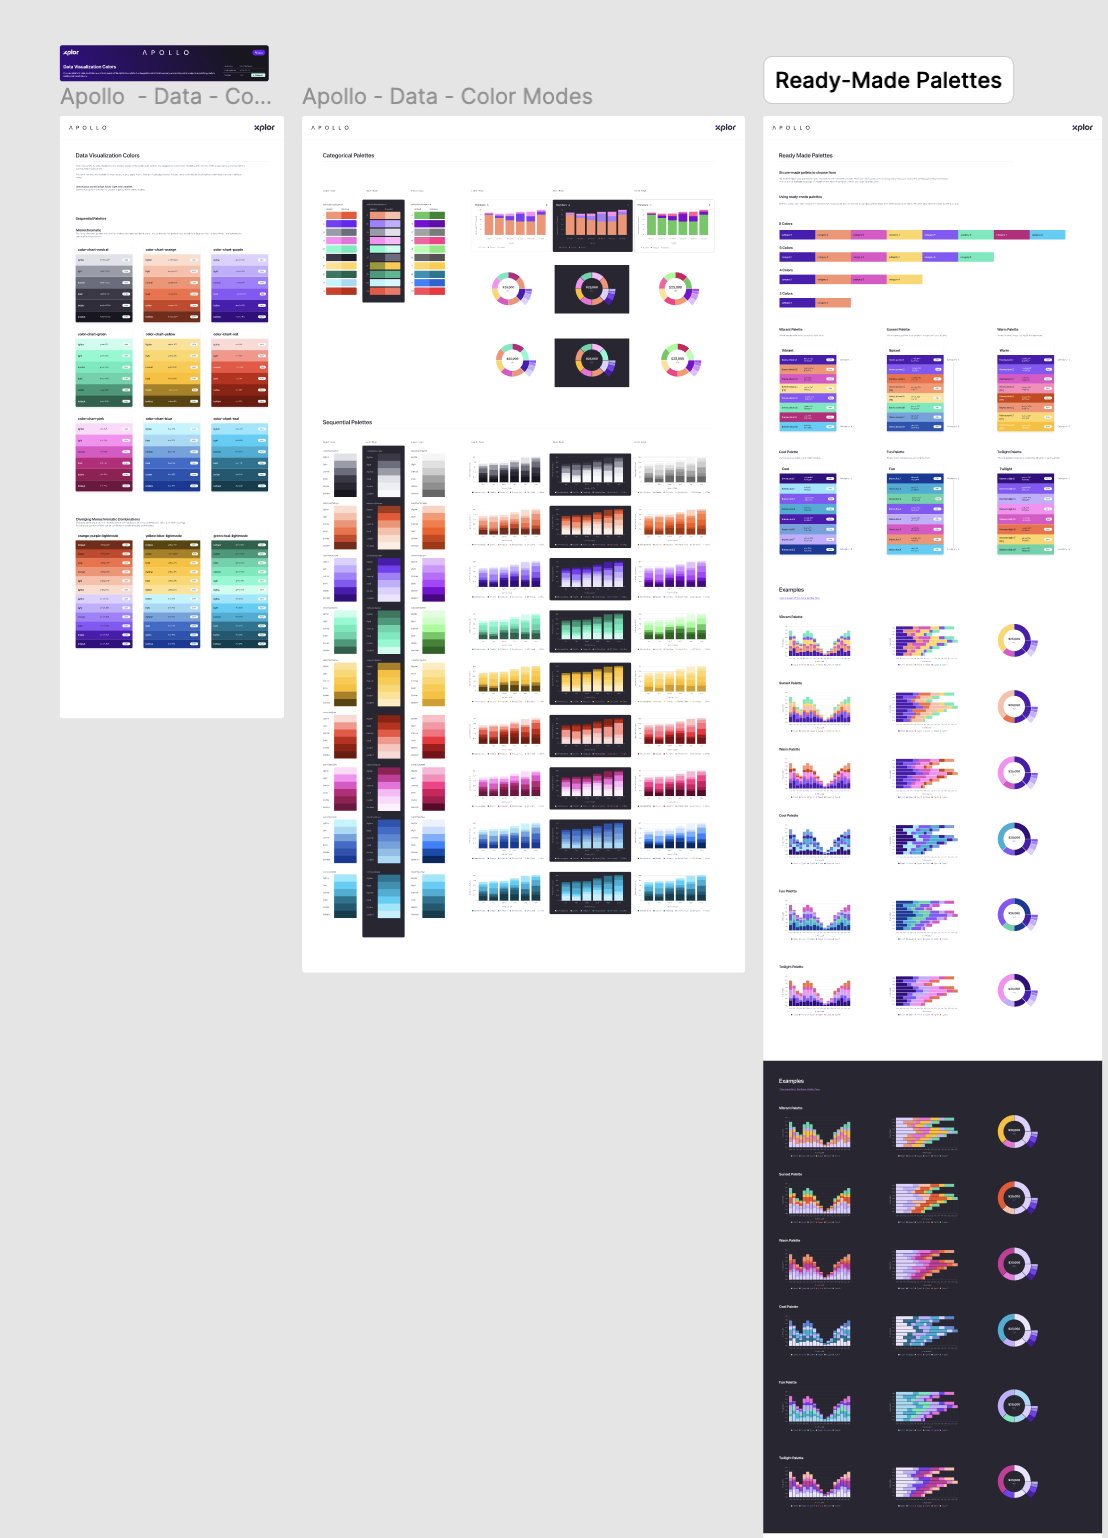
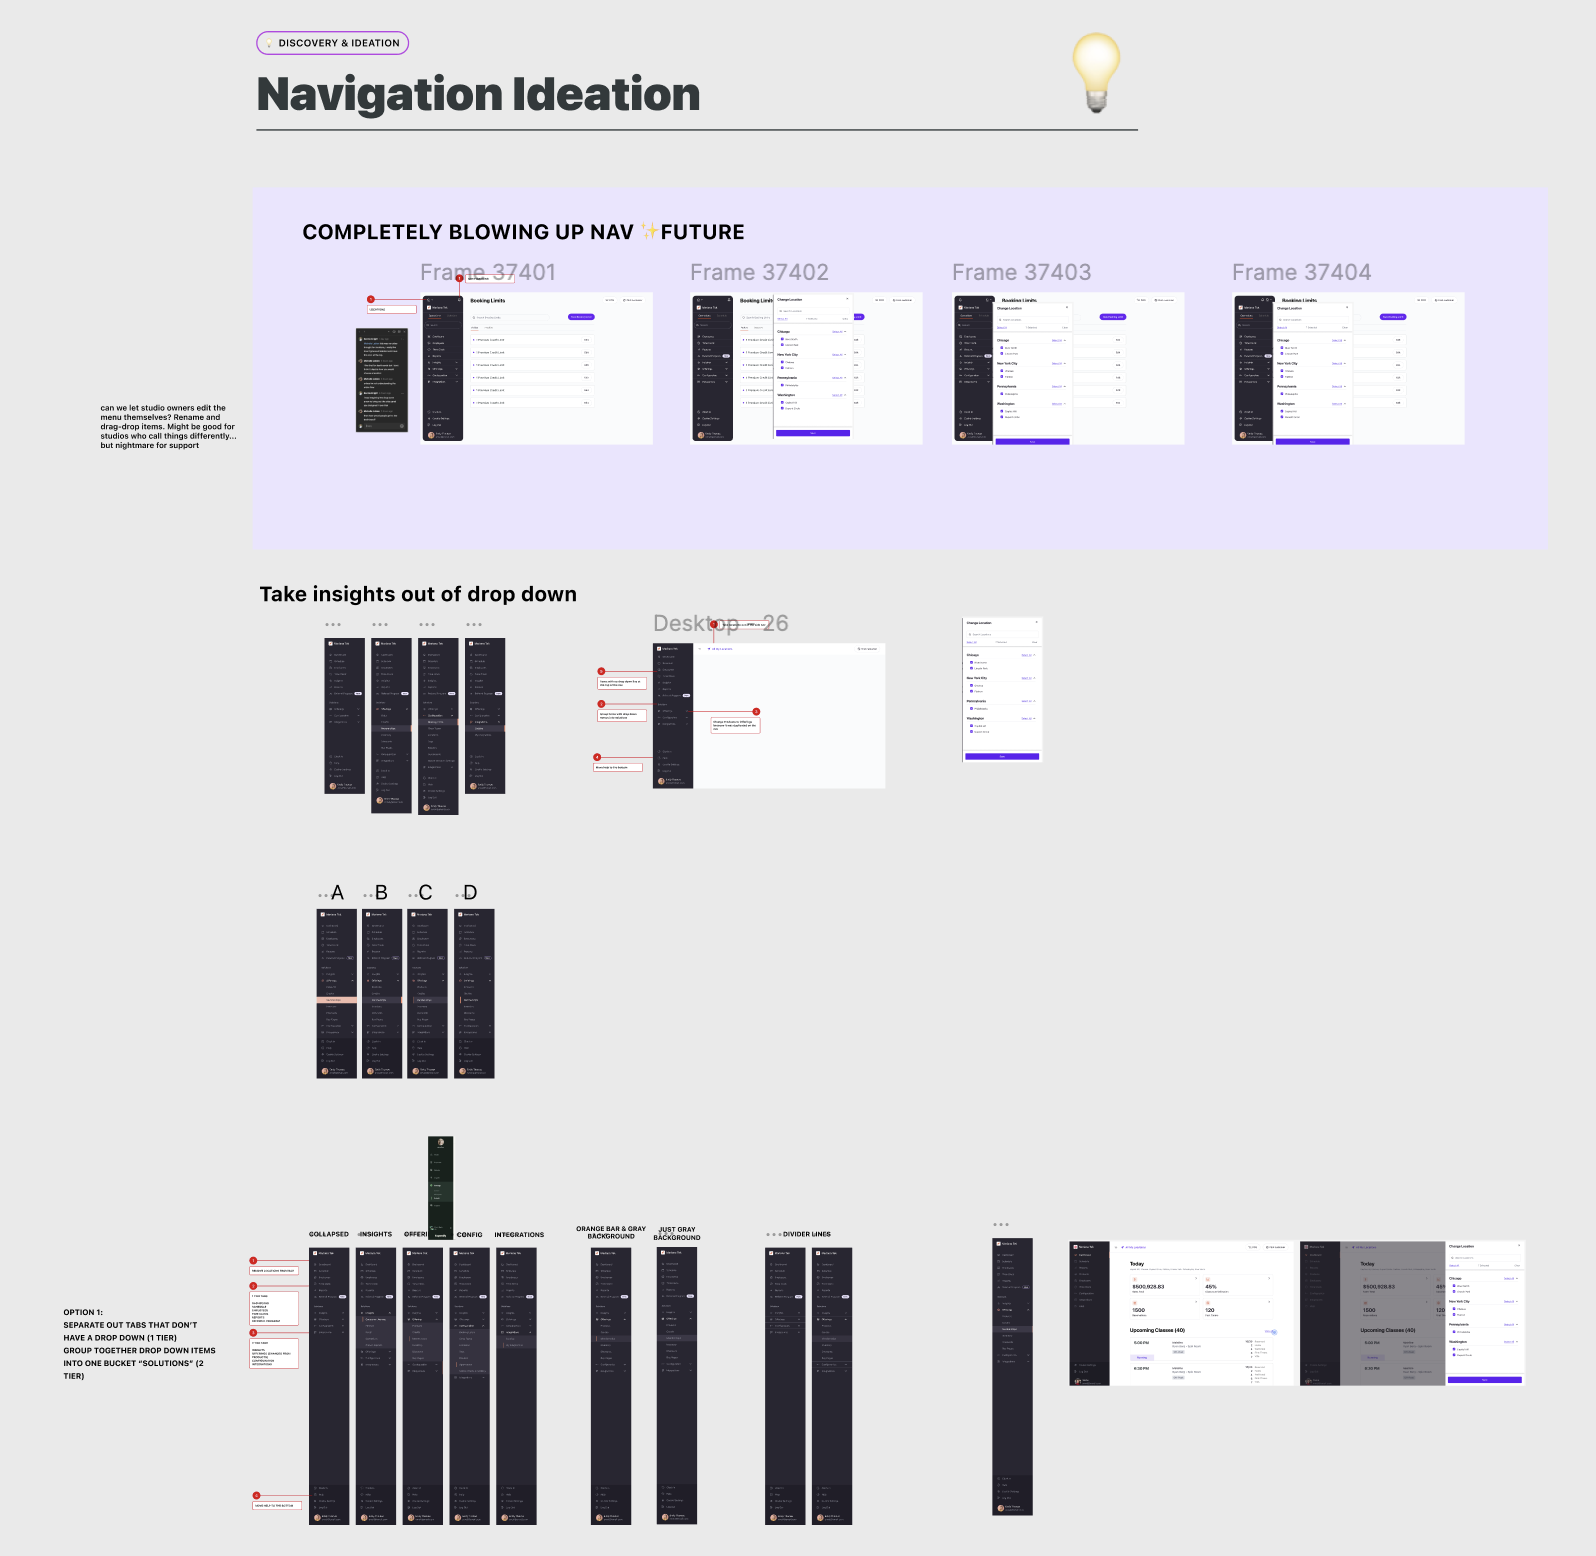
I collaborated with our design systems designer to develop new color palettes for data visualizations within our design system. I also gathered feedback on different designs for donut charts, line charts, KPI cards, new navigation, while working with the product team to explore ways users could favorite reports for easier access.
AI Sandboxing
I explored different approaches to report navigation and organization, using AI to quickly prototype and iterate on ideas.
Final Design
Insights is a large, ongoing initiative focused on making reporting easier to navigate and understand. These designs represent a step toward a more intuitive experience, with continued improvements shaped by user feedback.